


World's most populous city

When it comes to the city with the world’s largest population, it really has been a ‘tale of three cities’ over the last two hundred years.
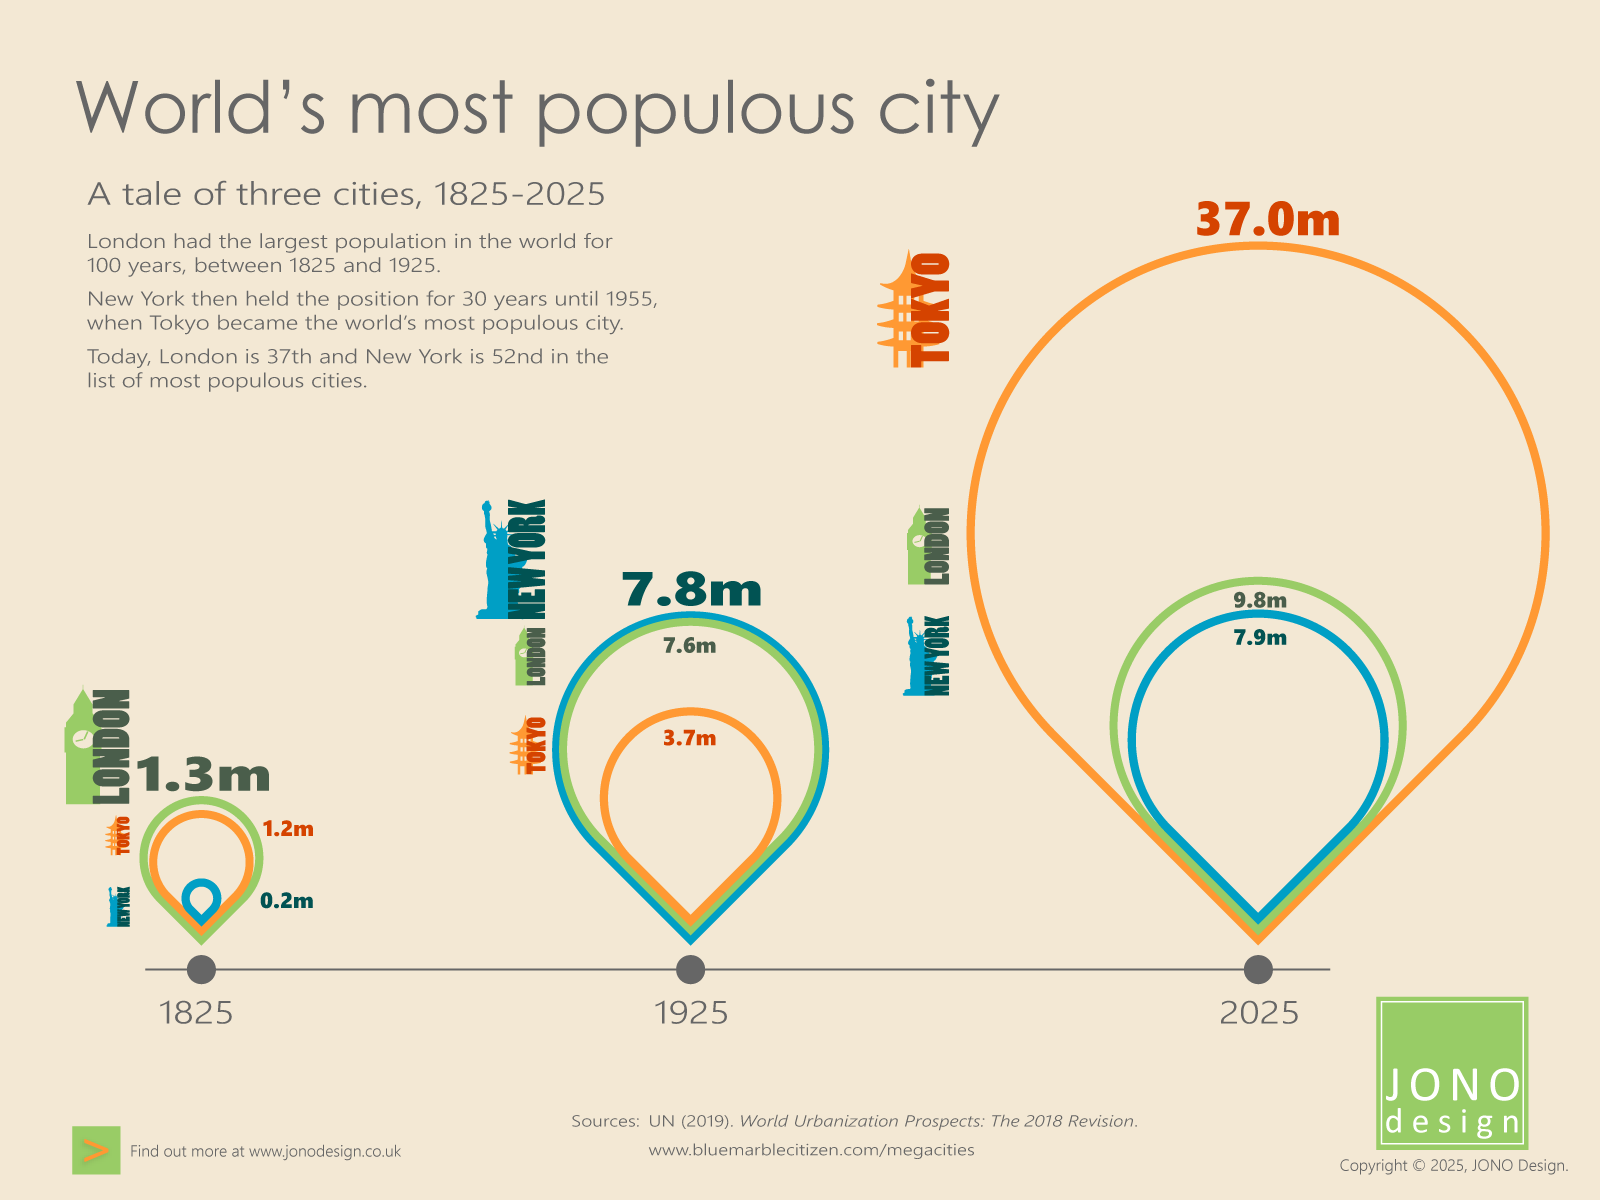
In 1825, London, with 1.3 million people, was the city with the largest urban population. It held that position for 100 years. Then, in 1925, New York took the pole position when its population reached 7.5 million. However, 30 years later, in 1955, New York was overtaken by Tokyo when the number of people in that city grew to 13.7 million.
Tokyo has since remained at the top of the list of the world’s most populous cities, with the population in 2025 reaching 37 million.
Click on the infographic to enlarge it.
Urban area
The area covered by continuous urban development is used to calculate the population of a city. This is different to any administrative boundary. A continuous urban area can cross administrative boundaries, and conversely, municipalities could contain built-up areas separated by countryside.
1825
London was the city with the world’s largest population in 1825, with 1,335,000 people. Tokyo was also a large city at this time, with 1,150,000 people. New York, with a population of only 160,000, was tiny in comparison.
1925
One hundred years later, New York’s population had exploded to 7,774,000 people to take the top spot in the list of most populous cities, pushing London – with a population of 7,553,000 – into second place. Tokyo, with 3,699,000 people, was third in the list.
2025
By 1955, Tokyo’s population had grown to 13,710,000, making it the city with the largest urban population. Tokyo still holds that position today: in 2025, there are 37,036,200 people living in the Tokyo urban area. At this time, London has the 37th largest population, with 9,840,740 people. New York, with 7,936,530 people, is 52nd in the list.
Infographic design
The size of the population of each city is represented by an upside-down teardrop shape that points to a year in the timeline. The shapes are proportional to each other. Shapes can show proportionality in relation both to the width and the height of each shape. This is in contrast to a bar graph, which would only show a difference in the height axis. Using shapes in this way in the infographic allows a more impactful visual comparison of the scale of change in population size between 1825 and 2025.
Colours and an icon of a city landmark are used to identify each of the three cities. London is indicated in green, with the Elizabeth Tower (commonly known as ‘Big Ben’) as the icon. Orange is used for Tokyo, with the Sensoji pagoda tower as the icon. New York is shown in blue, with the Statue of Liberty as the icon.
Sources
United Nations, Department of Economic and Social Affairs, Population Division (2019). World Urbanization Prospects: The 2018 Revision (ST/ESA/SER.A/420). New York: United Nations.
www.bluemarblecitizen.com/megacities
www.weforum.org
This infographic appeared in JONO Design e-news. The e-news is published once every couple of months and each issue contains a specially designed infographic.
Click on the orange button to sign up for JONO Design e-news.

Get in touch to discuss your design requirements
or to request a quote.

enquiries@jonodesign.co.uk

Copyright © 2015-2026 JONO Design.
Designing solutions with Word