


Plastics in Scottish Seas

Plastic litter often ends up in watercourses that carry this pollution out to the open sea. Research has estimated that 1000 tonnes of macroplastic litter pollute the seas around Scotland every year.
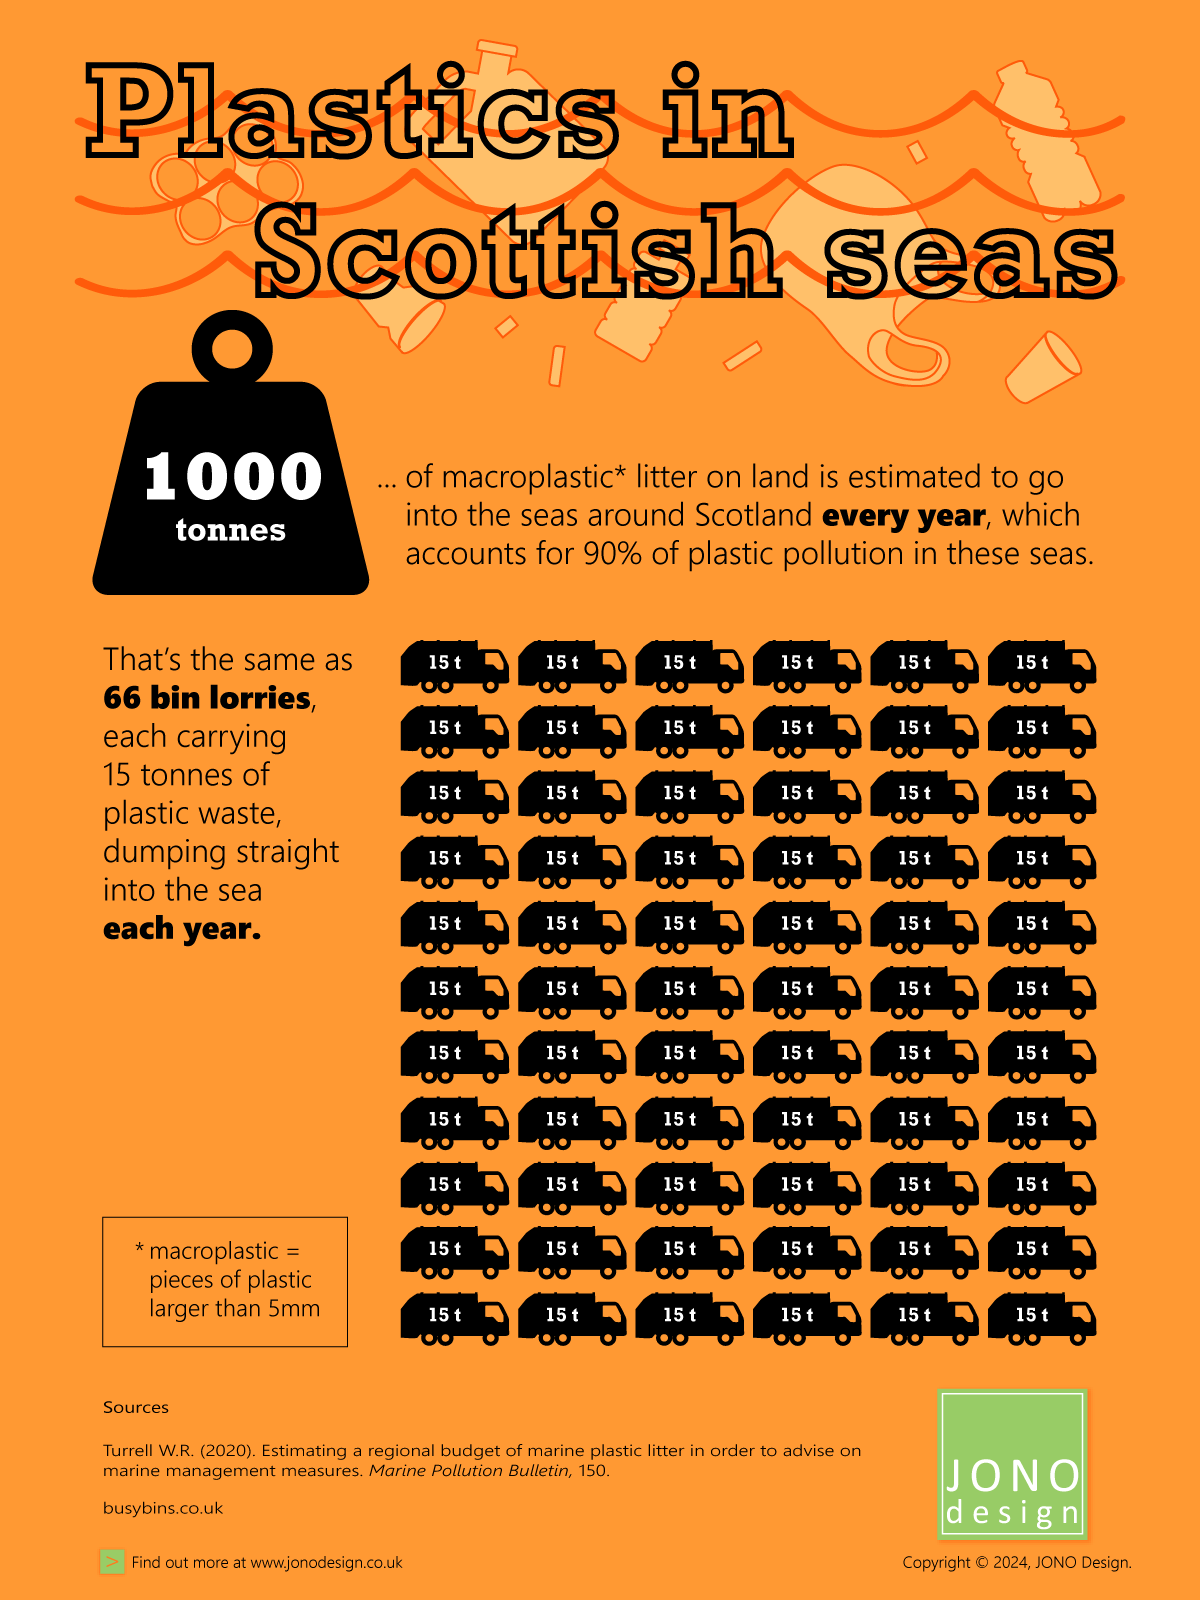
This infographic highlights the scale of the pollution by comparing it to the amount of waste carried by bin lorries. The plastic pollution entering Scotland’s seas is equivalent to 66 full bin lorries dumping their load straight into them.
Click on the infographic to enlarge it.
Macroplastic pollution
The term ‘macroplastic’ is used to describe pieces of plastic that are larger than 5mm in size. This includes whole plastic items, as well as fragments that have been broken off or have eroded into separate smaller pieces.
According to research, 1000 tonnes (1 tonne = 1000 kilogrammes) of macroplastic that is littered on land ends up each year polluting the seas around Scotland. This plastic debris accounts for 90% of all the plastic found in the areas of the Atlantic Ocean and the North Sea that surround Scotland. The plastics in the sea can be carried and circulated around in the water, settle on the seabed, or be washed up onto beaches and coastlines – polluting the environment in each case.
Scale of pollution
In order to better visualise the scale of the plastic pollution that is entering the seas around Scotland, the infographic compares the amount of plastic with the amount of waste carried by a bin lorry (or Refuse Collection Vehicle to use the official term). Bin lorries can carry anywhere between 10 tonnes and 26 tonnes, depending on the size of the vehicle and the volume of the waste material.
The infographic assumes that one bin lorry will carry 15 tonnes of plastic waste. Therefore, 66 bin lorries would be needed to carry the corresponding amount of macroplastic litter generated on land and then dump it straight into the sea every year..
Microplastics in the environment
Microplastic, as distinct from macroplastic, refers to pieces of plastic that are smaller than 5mm. The amount of waste microplastic found in the environment is considered in two other infographics created by JONO Design. The first visualises the amount of microplastics that are getting into the food that we eat. The second illustrates the pollution of UK rivers by microplastics caused by tyre wear. All three infographics that consider plastic pollution share the same basic design elements by using the same main colours and font.
Sources
Turrell W.R. (2020). Estimating a regional budget of marine plastic litter in order to advise on marine management measures. Marine Pollution Bulletin, Volume 150.
busybins.co.uk
This infographic appeared in JONO Design e-news. The e-news is published once every couple of months and each issue contains a specially designed infographic.
Click on the orange button to sign up for JONO Design e-news.

Get in touch to discuss your design requirements
or to request a quote.

enquiries@jonodesign.co.uk

Copyright © 2015-2026 JONO Design.
Designing solutions with Word